Onboarding and paywall funnels: what to track
On this page
For most subscription apps, the first few minutes decide nearly everything. Someone installs, goes through onboarding, meets a paywall, and either starts a trial or leaves. If you can see where people drop out of that sequence, you know what to fix next. If you can't, you're guessing, and the usual guess (change the paywall price) is often the wrong one.
This post is a practical list of what to track between install and purchase, how to name it, which numbers to watch, and the mistakes that make funnels lie.
The funnel, step by step
A typical subscription app funnel has five steps:
- Install: the app was opened for the first time.
- Finished onboarding: the person got through your intro screens and questions.
- Saw the paywall: your offer was shown.
- Started a trial (if you offer one).
- Paid: a first purchase, or a trial that converted.
- Install1,000
- Finished onboarding640−36%
- Saw the paywall560−13%
- Started a trial120−79%(biggest drop)
- Paid48−60%
Biggest drop: Started a trial
Some apps add created an account between 2 and 3, or put the paywall in the middle of onboarding. That's fine. The funnel should follow your app, not a template. Just keep it short: five or six steps you'll actually act on beat twenty you'll never read.
The events
Each step is an event your app sends at a specific moment. The moment matters more than the name.
| Feature | Send it when | What it tells you |
|---|---|---|
| Onboarding screen | Each onboarding screen appears (not when its button is tapped), with the screen's name | Which screen people leave on, and how long each takes |
| Onboarding skipped | Someone taps Skip, with the screen they skipped from | Whether Skip is a shortcut or an escape |
| Onboarding completed | The last onboarding screen is done, before any paywall or sign-up that follows | Your onboarding completion rate |
| Paywall viewed | Every time a paywall appears, with where it appeared (onboarding, feature_gate, settings) | Paywall reach, and which placement converts |
| Paywall skipped | Someone closes the paywall without buying | Whether people dismiss it or never see it |
| Sign-up / sign-in | A new account is created / someone signs in to an account they already had | New users versus returning ones, so reinstalls don't look like new sign-ups |
| Trial started, purchase | The store confirms it | Conversion, and the money |
A few rules make these events trustworthy:
- Fixed, short names for screens, such as
goal,notifications,plan. Not "Screen 3", which changes meaning the day you reorder onboarding. - A placement on every paywall. The paywall at the end of onboarding and the one behind a locked feature are different offers to different people. Mix them and both numbers become meaningless.
- Sign-up only for new accounts. If returning users who sign in on a new phone also send
sign_up, your sign-up rate goes up every time someone reinstalls. - Purchases from the source of truth. A purchase sent from the app can't see renewals, refunds or trials that convert while the app is closed. If you use RevenueCat or a server, let it report purchases instead.
Never put answers or personal data in events
The numbers to watch
Turn the events into a few rates and look at them every week.
- Onboarding completion: finished onboarding ÷ installs. Low? Look at the screen-by-screen drop-off.
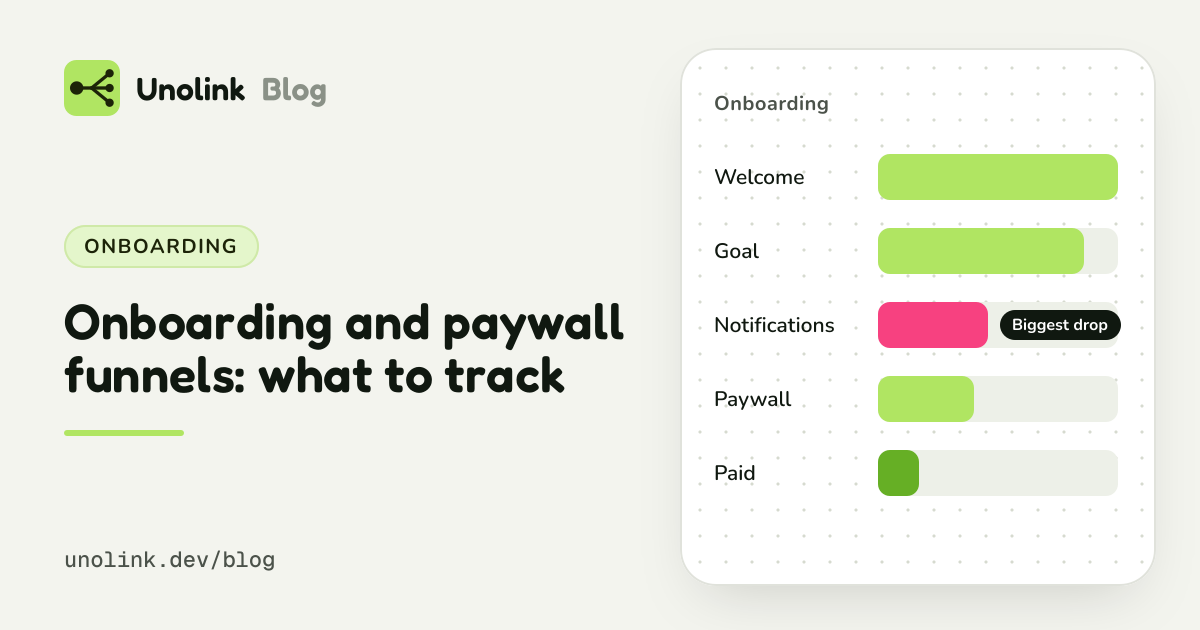
- Biggest single drop: the screen where the most people leave. Fix that one first; it's almost always a permission request shown too early, a long form, or a slow screen.
- Paywall reach: saw the paywall ÷ installs. If this is low, the paywall isn't your problem: people never get there.
- Paywall conversion: trial or purchase ÷ saw the paywall, per placement.
- Trial to paid: paid ÷ started a trial, measured only on trials old enough to have ended.
- Time to pay: how many days after install people first pay. It tells you how long to wait before judging a week's installs.
Look at them per source too. People who came from a creator's video often behave nothing like people from a search ad, and an average across both hides what each needs.
Mistakes that make funnels lie
Counting by event date instead of install date
If you count "payments this week" against "installs this week", a trial started last week that converts on Tuesday lands in the wrong cohort. Pick people by when they installed, then count everything they did afterwards, however late. Expect last week's numbers to go up as late payers arrive; that's correct, not a bug.
Requiring a strict order when your app doesn't have one
If someone can see the paywall before finishing onboarding (a "skip to plans" button, say), a strict ordered funnel drops them. Count each step for anyone who did it at any time, and use a strict order only when you're asking a question about sequence.
Calling people "gone" too soon
Someone who hasn't finished onboarding after ten minutes may be making dinner. Give it a day before you call it a drop-off.
Test devices in your numbers
Your own debug builds, TestFlight installs and sandbox purchases inflate every step. Keep them out automatically, not by remembering to filter.
Too few people
With 40 installs, one extra purchase moves conversion by more than two points. Before comparing two versions, wait until each has enough people that the difference isn't noise.
Doing it with Unolink
Setting all this up by hand means an analytics tool, a funnel builder, a purchase feed and a spreadsheet to join them. The Unolink SDK (Pro plan and up, $19 a month) does it in one place. It's a small library for iOS, Android, React Native and Flutter, with a ready-made event for each step above, so you add one line per moment and skip the naming debates. The events reference lists them.
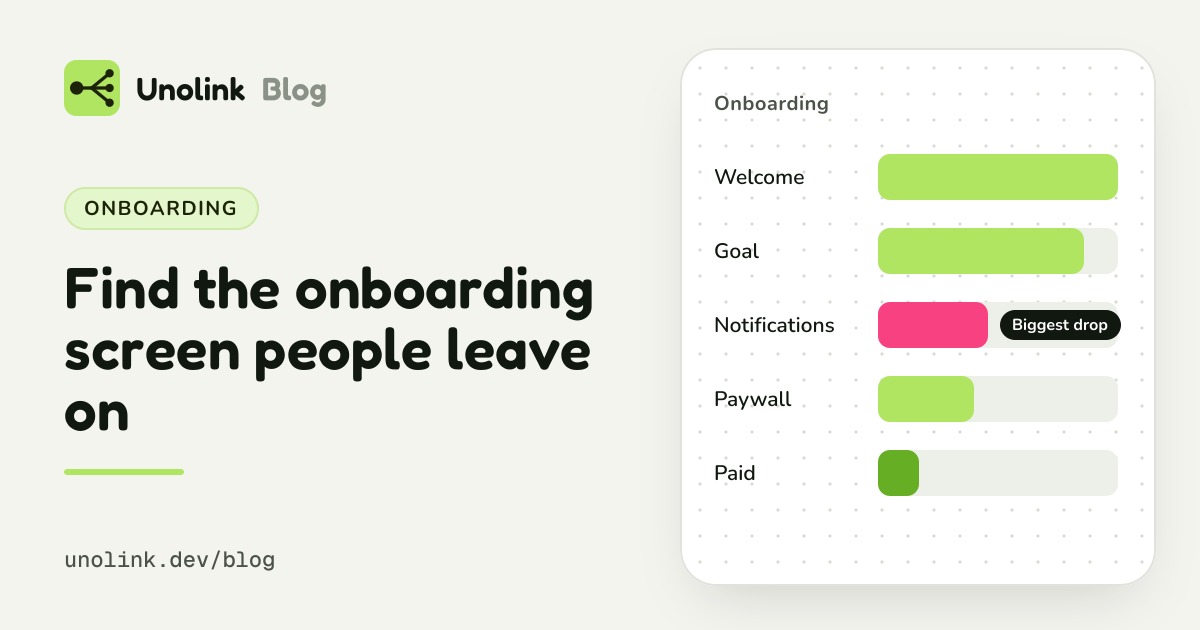
- Onboarding shows each screen's reach, how many left there, how many skipped and how long it took. Screen events are free: they don't count towards your plan's monthly event allowance. See Find the onboarding screen people leave on.
- Funnel counts people by install date and includes late payments. Steps count at any time, with an optional "Count steps only in this order". Split it by link, UTM, platform, country, onboarding screen or paywall placement.
- Journeys show each install from click to purchase: its path, where it left onboarding and when it paid.
- Report points out leaks, spikes and how long people take to pay, using fixed rules on your own numbers, no AI.
- New versus returning users are told apart, so reinstalls don't look like new sign-ups.
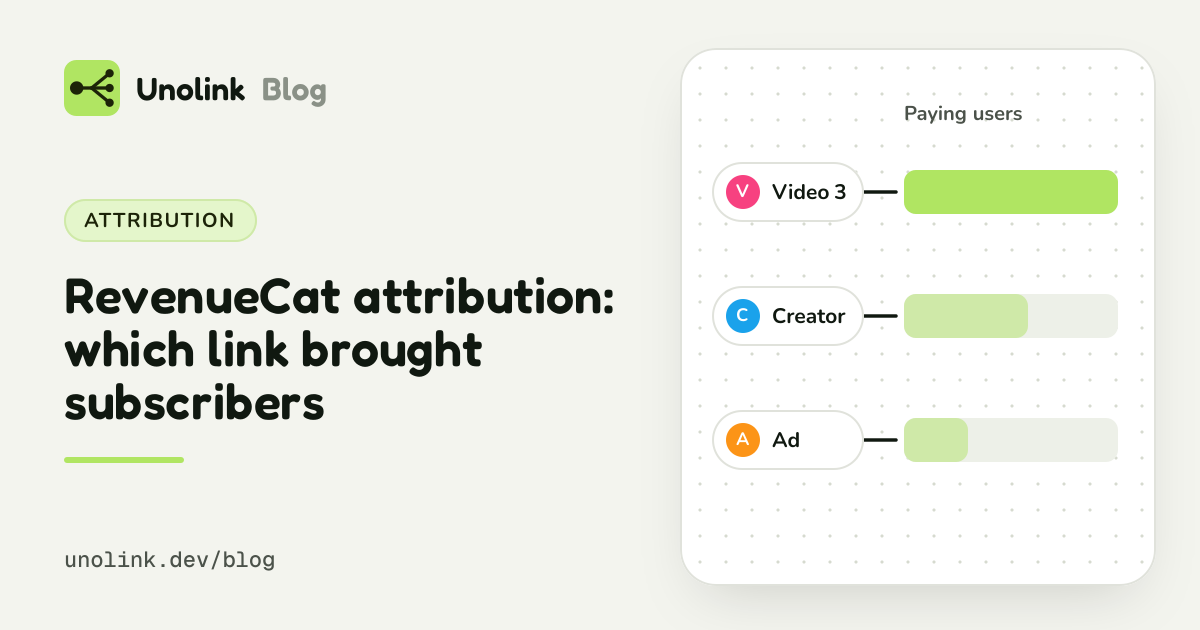
- RevenueCat connects in one line, then trials, purchases, renewals and refunds arrive by themselves and nothing counts twice. See RevenueCat attribution.
- Test devices are left out automatically.
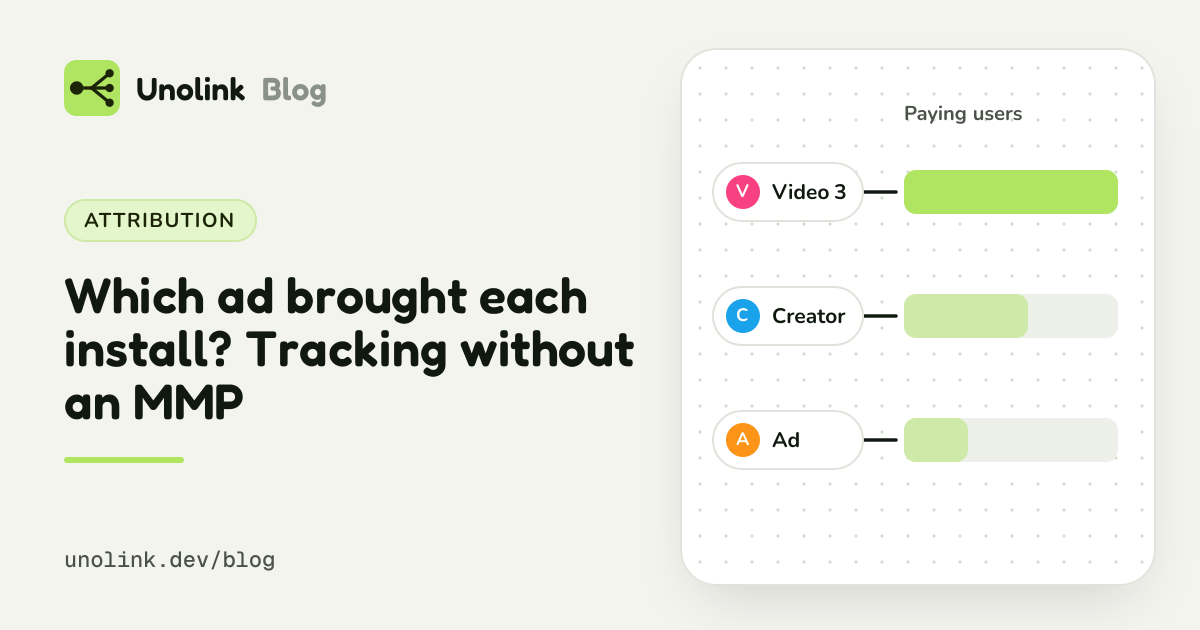
Because Unolink also knows which link brought each install, the same funnel splits by post, creator or ad. That's how you learn the creator with fewer installs actually brought more paying users.
Share this article